


-
Nassim Taleb introduces the concepts of Mediocristan and Extremistan to differentiate between environments characterized by thin-tailed and fat-tailed distributions, respectively.
-
In Mediocristan, extreme deviations are exceedingly rare and have minimal effect on the overall system.
-
In Extremistan, extreme deviations are more probable and can disproportionately affect the total or average.
-
In Mediocristan, mean and variance are reliable and accurately describe the dataset.
-
In Extremistan, mean and variance may not accurately represent the data, leading to underestimating risks.
-
In fat-tailed environments, rely less on averages and more on strategies robust to outliers.
-
When dealing with uncertain environments without natural constraints, it’s prudent to assume a fat-tailed distribution.
Table of Contents: (Click any link below to navigate to that section.)
- Provide the key take-aways from the following interview:
- 1. Thin Tails vs. Fat Tails (Mediocristan vs. Extremistan)
- 2. Heuristics for Determining Distribution Type
- 3. Power Laws and Tail Exponents
- 4. Forecasting and Risk Management
- 5. Errors in Behavioral Economics
- 6. Misunderstanding of Probability and Correlation
- 7. Shadow Mean and Underestimation of True Risks
- 8. Survival and Precautionary Principle
- Quiz
- Provide 30 discussion questions relevant to the content above.

Provide the key take-aways from the following interview:
Nassim Taleb — Meditations on Extremistan (#158)
Sep 20, 2024 Epistemology
1. Thin Tails vs. Fat Tails (Mediocristan vs. Extremistan)
Understanding the nature of statistical distributions is fundamental to modeling, prediction, and risk management. Nassim Taleb introduces the concepts of Mediocristan and Extremistan to differentiate between environments characterized by thin-tailed and fat-tailed distributions, respectively.
Mediocristan: Domains with Thin-Tailed Distributions
Properties:
- Exponential Decay of Probabilities: The probability density function decreases exponentially as values move away from the mean.
- Negligible Impact of Outliers: Extreme deviations are exceedingly rare and have minimal effect on the overall system.
- Applicability of Classical Statistical Laws:
- Law of Large Numbers: Sample means rapidly converge to the population mean as the sample size increases.
- Central Limit Theorem: The sum of independent random variables tends toward a normal distribution, regardless of the original distributions.
Examples:
- Human Height and Weight:
- Most adults fall within a certain height and weight range due to biological constraints.
- It’s biologically impossible for a person to be 10 meters tall.
- Measurement Errors in Physical Experiments:
- Errors are typically small and symmetrically distributed around zero.
Implications:
- Stable Statistical Parameters: Mean and variance are reliable and accurately describe the dataset.
- Predictive Reliability: Future observations are likely to fall within a predictable range.
- Risk Assessment: Extreme outcomes are so unlikely that they can often be ignored for practical purposes.
Extremistan: Domains with Fat-Tailed Distributions
Properties:
- Polynomial Decay of Probabilities: The probability density function decreases polynomially (following a power law) as values move away from the mean.
- Significant Impact of Outliers: Extreme deviations are more probable and can disproportionately affect the total or average.
- Challenged Statistical Laws:
- Slow Convergence of the Mean: The Law of Large Numbers applies slowly, requiring enormous sample sizes for the sample mean to be reliable.
- Infinite or Undefined Moments: Mean and variance may not exist or may be infinite.
Examples:
- Wealth Distribution:
- A small number of individuals hold a large portion of the total wealth.
- There’s no upper limit to how much wealth a person can accumulate.
- Financial Market Returns:
- Stock prices can experience sudden and extreme changes.
- Natural Disasters:
- Earthquake magnitudes and pandemic sizes follow fat-tailed distributions, where rare but catastrophic events occur.
Implications:
- Misleading Traditional Statistics: Mean and variance may not accurately represent the data, leading to underestimating risks.
- Necessity to Anticipate Extreme Events: Extreme events are not anomalies but integral to the system.
- Risk Management Challenges: Predicting and preparing for rare but impactful events is crucial, as standard models may fail to account for the true probability of outliers.
Key Asymmetry Between Mediocristan and Extremistan
- In Mediocristan (Thin-Tailed):
- Outliers are anomalies and have minimal impact.
- Significant deviations suggest a possible problem with the model or data.
- In Extremistan (Fat-Tailed):
- Outliers are expected and can dominate the dataset.
- Large deviations are inherent to the distribution and must be planned for.
Hypothetical Scenario Illustrating the Concepts
Scenario Part 1: Mediocristan (Thin-Tailed Distribution)
Imagine you’re measuring the heights of all the students in your high school to find the average height.
- Data Collection:
- Most students are between 5 feet (152 cm) and 6 feet (183 cm) tall.
- The tallest student is 6’5″ (196 cm), and the shortest is 4’10” (147 cm).
- Biological Constraints:
- Human height is limited by genetics and biology.
- It’s impossible to find a student who is 10 feet (305 cm) tall.
Implications:
- Reliable Average Height: The calculated average height is a dependable estimate of the true average height.
- Predictable Variations: Future measurements are unlikely to differ drastically from current findings.
Explanation:
This scenario represents Mediocristan, where the distribution of heights is thin-tailed. Extreme values are rare and bounded, making statistical measures like the mean reliable.
Scenario Part 2: Extremistan (Fat-Tailed Distribution)
Now, imagine you’re analyzing the number of followers students have on social media platforms.
- Data Collection:
- Most students have between 100 and 500 followers.
- One student went viral and has 1 million followers.
- Lack of Upper Limits:
- There’s no theoretical maximum to how many followers someone can gain.
Implications:
- Skewed Average Number of Followers: The student with 1 million followers significantly increases the average number of followers.
- Unpredictable Variations: Future data could include students with even more followers, further impacting the average.
Explanation:
This scenario exemplifies Extremistan, characterized by a fat-tailed distribution. Rare events (like going viral) have a massive impact on the dataset, making averages unreliable.
Conclusion and Practical Takeaways
- Assuming Distribution Types: Analyze the nature of the domain to determine if it belongs to Mediocristan or Extremistan.
- Risk Management:
- In Mediocristan, standard statistical methods are sufficient.
- In Extremistan, prepare for extreme events and recognize that traditional statistics may underestimate risks.
- Decision-Making:
- In fat-tailed environments, rely less on averages and more on strategies robust to outliers.
- Consider worst-case scenarios and their potential impact.
Final Thought:
When dealing with uncertain environments without natural constraints, it’s prudent to assume a fat-tailed distribution. This ensures realistic risk assessments and that extreme events are not overlooked.
2. Heuristics for Determining Distribution Type
Understanding whether a dataset follows a thin-tailed or fat-tailed distribution is crucial for selecting appropriate statistical models and for effective risk management. Nassim Taleb provides several heuristics to help determine the type of distribution relevant to a particular domain.
Heuristics for Identifying Distribution Types
- Physical and Biological Constraints
- Thin-Tailed Indicators:
- The variable is bounded by natural or physical limits.
- Extreme values are physically impossible or biologically unfeasible.
- Examples:
- Human Characteristics: Human heights and weights have natural limits due to biological factors. No human can be 10 meters tall.
- Material Properties: The strength of materials is limited by molecular bonds.
- Multiplicity and Scalability
- Fat-Tailed Indicators:
- The variable can scale without a strict upper limit.
- The process involves multiplicative effects or positive feedback loops.
- Examples:
- Financial Markets: Asset prices can, in theory, rise or fall without bound.
- Social Media Virality: Content can be shared infinitely, leading to potentially unlimited reach.
- Observation of Extreme Events
- Fat-Tailed Indicators:
- Frequent or impactful outliers suggest a fat-tailed distribution.
- The presence of extreme events that significantly impact the total.
- Caution:
- The absence of observed outliers does not confirm a thin-tailed distribution, as rare events may not have occurred yet in the sample.
- Domain Knowledge and Underlying Mechanisms
- Understanding the processes that generate the data can reveal whether constraints exist.
- Multiplicative Processes:
- Systems where outcomes are the product of many random variables tend to produce fat-tailed distributions.
- Example: Compound interest in finance leads to wealth disparities following a power-law distribution.
- Empirical Testing
- Statistical Methods:
- Use statistical tests to assess the heaviness of tails.
- Plotting data on log-log scales can help identify linear patterns indicative of power laws.
- Tail Index Estimation:
- Estimators like the Hill estimator can quantify the tail exponent of the distribution.
Implications for Model Selection and Risk Management
- Model Selection
- Thin-Tailed Distributions:
- Appropriate when natural constraints enforce limits on variability.
- Gaussian or other thin-tailed models can be reliably used.
- Fat-Tailed Distributions:
- Necessary when extreme events are plausible and can significantly impact outcomes.
- Models must accommodate the possibility of large deviations from the mean.
- Risk Management
- Thin-Tailed Domains:
- Standard risk assessment techniques are generally adequate.
- Predictive models can focus on central tendencies.
- Fat-Tailed Domains:
- Risk assessments must account for the significant probability and impact of extreme events.
- Strategies should be robust to outliers and not rely solely on historical averages.
- Preparedness for rare but catastrophic events is essential.
Hypothetical Scenario Illustrating the Concepts
Scenario Part 1: Thin-Tailed Distribution
You’re organizing a school bake sale to raise funds for a class trip. You want to predict how much each customer will spend.
- Observations:
- Baked goods are priced between $1 and $5.
- Customers typically buy one or two items.
- Constraints:
- No customer is going to spend $1,000 on cookies at a school bake sale due to the low prices and the nature of the event.
Implications:
- Predictable Spending:
- You can expect most customers to spend between $1 and $10.
- The total revenue can be estimated reliably based on the number of customers.
Explanation:
This scenario represents a thin-tailed distribution. Spending is naturally limited by the prices of the items and the setting of a school bake sale. Extreme values (someone spending $1,000) are virtually impossible, making the average spending a meaningful and reliable statistic.
Scenario Part 2: Fat-Tailed Distribution
Now, suppose you’re also selling raffle tickets at the bake sale for a chance to win a big prize. Tickets cost $1 each.
- Observations:
- Some people might buy 1 ticket.
- Others might buy 10, 50, or even 1,000 tickets.
- Lack of Constraints:
- There’s no strict limit on how many tickets a person can purchase.
- A single individual could significantly impact total sales.
Implications:
- Unpredictable Spending:
- While many customers will spend small amounts, a few might spend large sums.
- The total revenue from ticket sales is highly sensitive to these large purchases.
- Skewed Averages:
- The average amount spent per customer could be misleading if dominated by a few large spenders.
Explanation:
This scenario exemplifies a fat-tailed distribution. Spending varies widely, and extreme values (like someone buying 1,000 tickets) are possible and can significantly affect total sales. Recognizing the potential for such outliers is crucial for accurate planning and risk management.
Conclusion and Practical Takeaways
- Assessment of the Domain:
- Analyze whether natural limits constrain the variable of interest.
- Consider whether the process allows for unlimited scaling or multiplicative effects.
- Modeling Approach:
- Use thin-tailed models when justified by constraints and lack of extreme variations.
- Employ fat-tailed models when extreme events are possible and impactful.
- Risk Management:
- In thin-tailed domains, standard statistical techniques are generally sufficient.
- In fat-tailed domains, prepare for rare but significant events, and ensure strategies are robust to extreme outcomes.
Final Thought:
By applying these heuristics, practitioners can select appropriate statistical models and develop risk management strategies that accurately reflect the underlying processes. This ensures better predictions, more effective planning, and greater resilience to unexpected events.
3. Power Laws and Tail Exponents
Understanding how extreme events occur and impact various systems is crucial in fields like finance, natural sciences, and social sciences. Power-law distributions and their associated tail exponents are fundamental concepts that help describe phenomena where rare events have outsized effects.
Power-Law Distributions and Tail Exponents
A power-law distribution is a type of statistical distribution where the frequency of an event decreases polynomially with the size of the event. It is defined by the relationship:

Where:
is the probability that the random variable
exceeds a certain value
.
is a normalization constant ensuring that the total probability sums to 1.
is the tail exponent, a positive real number that characterizes the distribution’s tail.
is the minimum value from which the power-law behavior is observed.
Interpretation of the Tail Exponent (
- Tail Heaviness:
- A smaller
- A larger
- Existence of Moments:
- The mean of the distribution exists only if
.
- The variance exists only if
.
- Higher moments (like skewness and kurtosis) require even larger
Applications and Observations
1: Financial Markets:
- Asset Returns:
- Stock market returns often exhibit fat-tailed behavior.
- Empirical studies estimate tail exponents (
- Taleb’s View:
- He suggests that the true
- Implications:
- Traditional risk models may underestimate the probability of large market crashes.
2: Wealth Distribution:
- Pareto Principle (80/20 Rule):
- A small percentage of people hold a large portion of the total wealth.
- The distribution of wealth follows a power law, with a tail exponent reflecting the degree of inequality.
- Implications:
- Policies and economic models need to account for significant wealth disparities.
3: Natural Phenomena:
- Earthquake Magnitudes:
- The Gutenberg-Richter law describes the frequency of earthquakes with a certain magnitude.
- Larger earthquakes are less frequent but release exponentially more energy.
- Implications:
- Disaster preparedness must consider the potential for rare but devastating earthquakes.
Challenges in Estimating Tail Exponents ()
- Data Limitations:
- Finite Samples:
- Rare extreme events may not appear in limited datasets.
- This absence can lead to underestimating the fatness of the tail.
- Measurement Errors:
- Inaccuracies in data collection can distort estimates.
- Methodological Variability:
- Different Estimation Techniques:
- Methods like Maximum Likelihood Estimation (MLE) or linear regression on log-log plots can yield different
- Methods like Maximum Likelihood Estimation (MLE) or linear regression on log-log plots can yield different
- Choice of
- The threshold from which the power-law behavior starts affects the estimation.
- Selecting
- Temporal and Contextual Factors:
- Changing Systems:
- Tail behavior may evolve over time due to structural changes in the system.
- For example, financial markets can become more or less volatile.
Implications for Risk Assessment and Modeling
- Underestimating Extreme Risks:
- Incorrect
- Underestimating
- Underestimating
- Consequences:
- Risk management strategies may be insufficient, leaving systems vulnerable to catastrophic failures.
- Model Robustness:
- Accommodating Uncertainty:
- Models should be flexible to incorporate a range of
- Scenario analysis and stress testing can help assess potential impacts.
- Models should be flexible to incorporate a range of
- Policy and Decision-Making:
- Informed Strategies:
- Recognizing the fat-tailed nature of certain phenomena leads to better preparation and response plans.
- For example, setting aside larger reserves in financial institutions to buffer against unexpected losses.
Conclusion
Estimating and interpreting the tail exponent
Hypothetical Scenario Illustrating the Concept
Scenario: Popularity of Online Content
Imagine you’re studying how many times articles are shared on a social media platform.
- Observations:
- Most Articles:
- The majority of articles are shared between 10 and 1,000 times.
- Viral Articles:
- A few articles are shared millions of times.
- No Upper Limit:
- There’s theoretically no maximum number of shares an article can receive.
- Data Analysis:
- Plotting the Data:
- You plot the number of articles against the number of shares on a log-log scale.
- The plot approximates a straight line, suggesting a power-law relationship.
- Understanding the Tail Exponent (
- Interpreting
- The slope of the line on the log-log plot is related to the negative of the tail exponent.
- A smaller
- Implications:
- Platform Management:
- The social media platform must handle sudden surges in traffic due to viral content.
- Content Creation Strategy:
- Writers and marketers focus on creating content with the potential to go viral, knowing it can dramatically increase reach and influence.
- Advertising Revenue:
- A significant portion of ad revenue may come from a few highly popular articles.
Explanation:
In this scenario, the distribution of article shares follows a power-law distribution, where most articles have modest shares, but a few achieve extremely high shares. The tail exponent (
Combining the Concepts
By integrating the rigorous explanation with the hypothetical scenario, we gain a comprehensive understanding of how power laws and tail exponents function in real-world situations. This knowledge is crucial for accurately modeling systems, anticipating extreme events, and making informed decisions in fields where rare but significant occurrences can have profound impacts.
4. Forecasting and Risk Management
Accurate forecasting and effective risk management are critical in fields like finance, economics, and any domain involving uncertainty and potential extreme events. Nassim Taleb highlights the limitations of traditional models that rely on thin-tailed (Gaussian) assumptions when applied to fat-tailed environments, such as financial markets. He advocates for strategies that account for the higher probability and impact of extreme events inherent in fat-tailed distributions.
Limitations of Traditional Forecasting Models
Assumptions in Traditional Models:
1: Gaussian Distribution of Returns:
- Asset returns are assumed to follow a normal distribution.
- Extreme deviations (more than 3 standard deviations from the mean) are considered highly improbable.
2: Constant Volatility:
- Volatility is presumed to be stable over time.
- Models do not account for sudden spikes in volatility during market stress.
3: Efficient Markets:
- Markets are believed to fully and immediately reflect all available information.
- Price movements are considered random and independent.
Example: Black-Scholes-Merton (BSM) Model
The Black-Scholes-Merton model for option pricing is based on these assumptions:

Where:
= price of a call option
= current price of the underlying asset
= strike price
= risk-free interest rate
= time to expiration
= cumulative distribution function of the standard normal distribution
and
are calculated as:

= volatility of the asset’s returns
Limitations Highlighted by Taleb:
- Underestimation of Extreme Events:
- The normal distribution significantly underestimates the probability of extreme market movements.
- Real-world data shows that large deviations occur more frequently than predicted.
- Volatility Clustering and Persistence:
- Volatility is not constant; it tends to cluster and can change rapidly.
- Models assuming constant volatility fail to capture this behavior.
- Mispricing of Risk:
- Relying on Gaussian assumptions leads to incorrect pricing of financial instruments, especially options.
- Risk measures like Value at Risk (VaR) may be severely underestimated.
Fat-Tailed Environments and Risk Management
In fat-tailed distributions, extreme events are more probable and impactful. This necessitates a different approach to forecasting and risk management:
- Higher Probability of Tail Events:
- The likelihood of large deviations from the mean is non-negligible.
- Standard deviation becomes a less meaningful measure of risk.
- Dominance of Outliers:
- A few extreme events can account for the majority of the variation.
- Ignoring these events can lead to catastrophic consequences.
Tail Hedging Strategies
Objective:
- Protect Portfolios Against Extreme Losses:
- Mitigate the impact of rare but severe events (Black Swans) on investments.
Approach:
- Acquire Instruments with Asymmetric Payoffs:
- Deep Out-of-the-Money Options:
- Options with strike prices far from the current market price.
- Low cost during normal conditions but highly valuable during extreme market moves.
- Use of Convex Financial Instruments:
- Instruments where the payoff increases disproportionately with the movement of the underlying asset.
Payoff Structure of Options:
- Call Option Payoff:

Put Option Payoff:

Where:
= asset price at expiration
Benefits of Tail Hedging:
- Protection Against Market Crashes:
- Gains from options offset losses in the core portfolio during downturns.
- Non-Linear Payoffs:
- Small investments can yield large returns in extreme scenarios.
- Psychological Comfort:
- Knowing that the portfolio is protected can prevent panic selling.
Challenges in Implementing Tail Hedging
1: Short-Term Performance Pressure:
- Regular small losses from hedging costs can reduce short-term returns.
- Investors and managers may be evaluated based on short-term performance metrics.
2: Cost of Hedging:
- Purchasing options requires paying premiums, which can accumulate over time.
- The cost must be justified by the potential benefits during crises.
3: Institutional Constraints:
- Investment policies may restrict the use of derivatives.
- Regulatory requirements can limit exposure to certain financial instruments.
4: Behavioral Biases:
- Overconfidence in models and underestimation of risks can discourage hedging.
- Herd behavior may lead to neglecting protective measures when others are not hedging.
Hypothetical Scenario Illustrating the Concept
Scenario: Managing a Retirement Fund
Imagine you are responsible for managing a retirement fund for teachers. The fund aims to provide stable growth to ensure retirees receive their pensions.
- Traditional Investment Strategy:
- Invest primarily in stocks and bonds based on historical averages.
- Assume that market returns are normally distributed and extreme losses are unlikely.
- Risks:
- A significant market downturn could drastically reduce the fund’s value.
- Retirees might face reduced benefits or delayed payments.
Implementing Tail Hedging:
- Step 1: Recognize Fat-Tailed Risks
- Acknowledge that financial markets exhibit fat-tailed behavior.
- Understand that extreme events, like the 2008 financial crisis, can and do happen.
- Step 2: Allocate Funds to Protective Instruments
- Invest a small portion (e.g., 2%) of the portfolio in deep out-of-the-money put options on major stock indices.
- Step 3: Monitor and Adjust Positions
- Regularly reassess the hedging strategy.
- Roll over options as they expire to maintain protection.
Outcome During a Market Crash:
- Without Hedging:
- The fund could lose a significant portion of its value.
- This could jeopardize the ability to pay out pensions.
- With Hedging:
- The put options increase substantially in value as markets decline.
- Gains from the options help offset losses in the main portfolio.
- The fund remains solvent, and retirees continue to receive their benefits.
Explanation:
By incorporating tail hedging, the retirement fund protects against catastrophic losses. While there is an ongoing cost to maintain the hedge, the benefit during extreme events ensures the fund’s primary objective—securing retirees’ futures—is met.
Conclusion and Practical Takeaways
- Recognize the Reality of Fat Tails:
- Understand that extreme events are more common than traditional models suggest.
- Adapt Risk Management Strategies:
- Use models and methods that account for fat-tailed distributions.
- Implement protective measures like tail hedging to mitigate severe risks.
- Balance Short-Term Costs with Long-Term Security:
- Accept that hedging may reduce short-term returns.
- Prioritize the long-term survival and stability of the portfolio.
- Continuous Monitoring and Flexibility:
- Regularly review risk exposures and adjust strategies as needed.
- Stay informed about market conditions and potential emerging risks.
- Educate Stakeholders:
- Communicate the importance of risk management to investors, clients, or beneficiaries.
- Explain the rationale behind hedging strategies to gain support despite short-term costs.
By appreciating the limitations of traditional forecasting models in fat-tailed environments and adopting robust risk management strategies like tail hedging, individuals and institutions can better navigate uncertainty and protect against devastating losses. This proactive approach emphasizes resilience and the importance of preparing for rare but impactful events.
5. Errors in Behavioral Economics
Understanding how people make decisions under uncertainty is a central concern in economics and psychology. Behavioral economics integrates insights from psychology into economic models to explain why people sometimes make seemingly irrational decisions. One of the foundational theories in this field is Prospect Theory, developed by Daniel Kahneman and Amos Tversky. Nassim Taleb critiques aspects of behavioral economics, highlighting limitations when dealing with environments characterized by fat-tailed distributions and emphasizing the importance of considering long-term survival over short-term gains.
Prospect Theory: Modeling Decision-Making Under Risk
Prospect Theory describes how people evaluate potential losses and gains, challenging the traditional Expected Utility Theory. Key components of prospect theory include:
1: Value Function over Gains and Losses:
- Reference Point: People evaluate outcomes relative to a reference point (e.g., current wealth), not in absolute terms.
- Concavity for Gains (
):
- The value function is concave for gains, reflecting diminishing sensitivity.
- Implication: People are risk-averse when it comes to gains; the subjective value of an additional dollar decreases as wealth increases.
- Convexity for Losses (
):
- The value function is convex for losses, also showing diminishing sensitivity.
- Implication: People are risk-seeking when facing losses; they may take risks to avoid sure losses.
- Loss Aversion (
):
- Losses loom larger than gains; people experience more pain from losses than pleasure from equivalent gains.
- Mathematical Representation:
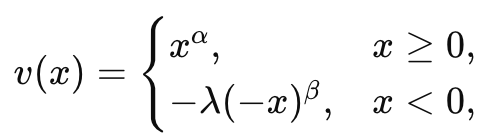
Where:
= parameters determining curvature (typically between 0 and 1).
= loss aversion coefficient (typically
2: Probability Weighting Function:
- People tend to overweight small probabilities and underweight large probabilities.
- Implication: Individuals may overvalue unlikely events (e.g., winning the lottery) and undervalue likely ones.
Taleb’s Critique of Behavioral Economics
Nassim Taleb raises concerns about the applicability of prospect theory and other behavioral economic models in environments where fat tails and extreme events dominate.
1: Underestimation of Tail Risks:
- Known Probabilities vs. Unknown Risks:
- Prospect theory assumes that probabilities and outcomes are known, which is rarely the case in real-world, complex systems.
- Fat-Tailed Distributions:
- In fat-tailed environments, extreme events are more probable and impactful than standard models suggest.
- Implication: Models based on thin-tailed assumptions (like normal distributions) underestimate the likelihood and impact of extreme events, leading to insufficient risk preparedness.
2: Ergodicity and Time Dynamics:
- Ergodicity:
- A process is ergodic if its statistical properties can be deduced from a single, sufficiently long, random sample of the process.
- Non-Ergodic Processes:
- In many real-life scenarios, especially with financial risks, outcomes over time for a single individual do not match the average outcomes across a group.
- Dynamic Risk:
- Repeated exposure to risks changes the nature of the risk due to compounding effects.
- Implication: A strategy that seems rational in a one-time gamble can lead to ruin when repeated over time.
3: Misinterpretation of Rationality:
- Survival Over Short-Term Gains:
- Avoiding ruin (survival) is more important than maximizing expected utility in the short term.
- Rational Behavior in Fat-Tailed Contexts:
- What may appear irrational (e.g., refusing a favorable bet) is actually rational when considering the risk of catastrophic losses.
Ergodicity and the Kelly Criterion
To address the challenges of decision-making over time, Taleb refers to concepts like ergodicity and the Kelly Criterion.
1: Kelly Criterion:
- Purpose:
- Provides a formula to determine the optimal size of a series of bets to maximize long-term wealth growth without risking ruin.
- Formula:

Where:
= fraction of current wealth to wager.
= probability of winning.
= net odds received on the wager (ratio of net profit to the stake).
Implication:
- Betting too much, even on favorable odds, can lead to ruin due to the variability of outcomes.
- The Kelly Criterion advises betting a fraction that balances growth and survival.
2: Non-Ergodic Systems:
- Wealth Dynamics:
- In non-ergodic systems, losing everything even once cannot be recovered over time.
- Implication:
- Strategies must prioritize avoiding total loss over maximizing short-term gains.
Conclusion and Practical Implications
- Limitations of Behavioral Models:
- Behavioral economic models may not adequately account for the complexities of real-world, fat-tailed environments.
- Assumptions of known probabilities and isolated decisions do not hold in many practical scenarios.
- Importance of Survival and Robustness:
- Decision-making should focus on long-term survival and resilience against extreme events.
- Avoid strategies that have a small probability of catastrophic loss, even if they offer favorable expected returns.
- Rethinking Rationality:
- Rational behavior involves considering the potential for extreme negative outcomes and the impact of repeated exposure to risk.
- What appears irrational in a simplified model may be entirely rational when accounting for fat tails and non-ergodic dynamics.
Hypothetical Scenario Illustrating the Concepts
Scenario: The Risky Game Show
You are a contestant on a game show and presented with two options:
- Option A:
- Chance to Win: 95% chance to win $100.
- Chance to Lose: 5% chance to lose $1,000.
- Option B:
- Guaranteed Win: 100% chance to win $90.
Question: Which option should you choose?
Typical Decision:
- Many people choose Option B, preferring the certainty of winning $90 over the risk associated with Option A.
- Behavioral Economics Explanation:
- Loss Aversion: The pain of potentially losing $1,000 outweighs the pleasure of possibly winning $100.
- Risk Aversion for Gains: People prefer a certain gain over a gamble with a higher expected value but some risk.
Calculating Expected Values:
- Option A Expected Value:

Option B Expected Value:

Analysis:
- Option B has a higher expected value ($90) compared to Option A ($45).
Taleb’s Perspective:
- Avoiding Catastrophic Losses:
- The potential loss of $1,000 in Option A could be devastating, especially if repeated over time.
- Survival and Ergodicity:
- If this game were played multiple times, the small chance of a large loss could lead to ruin.
- Opting for smaller, guaranteed gains ensures long-term wealth preservation.
Explanation:
- Rational Decision:
- Choosing Option B is rational when considering the risk of significant loss and the impact over time.
- Flaws in Simplistic Models:
- Traditional models might suggest Option A is better due to higher potential gains, but they fail to account for the disproportionate impact of large losses.
Connecting the Concepts
- Understanding Real-World Decision-Making:
- Decisions are rarely made in isolation; they have consequences over time.
- Accounting for the possibility of extreme outcomes is essential for rational decision-making.
- Application in Finance and Investing:
- Investors should be wary of strategies that offer high returns but carry a small chance of catastrophic loss.
- Emphasizing portfolio robustness and risk management over chasing high but risky returns aligns with long-term survival.
Key Takeaways
- Behavioral economics provides valuable insights into human decision-making but has limitations in fat-tailed environments.
- Taleb’s critique emphasizes the importance of considering tail risks, ergodicity, and the potential for ruin in decision-making.
- Survival and long-term success require strategies that are robust to extreme events, even if they seem conservative in the short term.
- Rationality should be viewed through the lens of long-term outcomes and the avoidance of catastrophic losses, not just immediate gains.
By integrating rigorous analysis with relatable examples, we can appreciate the complexities of decision-making under uncertainty and the necessity of accounting for extreme risks in both personal choices and broader economic models.
6. Misunderstanding of Probability and Correlation
Understanding the relationship between variables is fundamental in statistics, data analysis, and various scientific disciplines. Correlation is a commonly used measure to quantify the linear relationship between two variables. However, Nassim Taleb emphasizes that in environments characterized by fat-tailed distributions, traditional interpretations of correlation can be misleading. He critiques the misuse and misunderstanding of correlation, especially when dealing with non-linear dependencies and extreme events.
Correlation Coefficient ( )
)
Definition:
- The Pearson correlation coefficient measures the strength and direction of a linear relationship between two continuous variables
and
.
- Formula:

where:


Properties:
: Perfect positive linear relationship.
: Perfect negative linear relationship.
: No linear relationship.
Limitations of Correlation in Fat-Tailed Environments
1: Non-Linearity:
- Correlation Measures Linear Dependence:
- It captures only linear relationships between variables.
- Non-linear relationships can exist even when the correlation coefficient is zero.
- Example:
- Variables related through a quadratic or exponential function may show low or zero correlation despite strong dependence.
2: Sensitivity to Outliers:
- Impact of Extreme Values:
- In fat-tailed distributions, extreme values (outliers) are more frequent.
- Outliers can disproportionately affect the correlation coefficient, making it unreliable.
- Misleading Results:
- A single extreme data point can inflate or deflate the correlation, masking the true relationship.
3: Misinterpretation of Magnitude:
- Non-Intuitive Scaling:
- A correlation of 0.5 is not “halfway” between no correlation and perfect correlation in terms of predictive power.
- The proportion of variance explained is
.
- For
,
, meaning only 25% of the variance is explained.
- Decision-Making Implications:
- Low to moderate correlations may not provide meaningful predictive capability.
- Overreliance on such correlations can lead to erroneous conclusions.
4: Assumption of Normality:
- Underlying Distributions:
- Correlation assumes that the variables are jointly normally distributed.
- In fat-tailed distributions, this assumption is violated.
- Effect on Statistical Tests:
- Significance tests for correlation coefficients rely on normality.
- Results may not be valid when distributions are fat-tailed.
Alternative Measures of Dependence
1: Mutual Information:
- Definition:
- A concept from information theory that measures the amount of information one random variable contains about another.
- Formula:

where:
is the joint probability density function of
and
are the marginal probability density functions of
Advantages:
- Captures both linear and non-linear dependencies.
- Sensitive to any statistical dependence, not just linear relationships.
2: Rank Correlation Coefficients:
- Spearman’s Rank Correlation:
- Measures the monotonic relationship between two variables using ranked data.
- Formula:

where:


Kendall’s Tau:
- Assesses the strength of association based on the concordance of pairs.
Advantages:
- Less sensitive to outliers.
- Do not assume a linear relationship.
3: Copulas:
- Definition:
- Functions that couple multivariate distribution functions to their one-dimensional marginal distribution functions.
- Application:
- Model dependencies separately from marginals.
- Useful in modeling joint distributions with fat tails.
Implications for Risk Management and Decision-Making
1: Risk Underestimation:
- Joint Extreme Events:
- In fat-tailed environments, the probability of simultaneous extreme events is higher than suggested by correlation.
- Portfolio Management:
- Assets considered uncorrelated under normal conditions may become highly correlated during market stress.
2: Misguided Confidence:
- Overreliance on Correlation:
- Using correlation coefficients to assess relationships can provide a false sense of security.
- Policy and Strategy Errors:
- Decisions based on misleading correlations can result in significant losses or failures.
3: Need for Robust Measures:
- Comprehensive Analysis:
- Employ alternative dependence measures that capture non-linear and tail dependencies.
- Stress Testing and Scenario Analysis:
- Evaluate how relationships between variables change under extreme conditions.
Hypothetical Scenario Illustrating the Concepts
Scenario: Student Grades and Study Time
Imagine a teacher wants to understand the relationship between the number of hours students study per week (
- Data Collection:
- The teacher collects data from 30 students.
- The study hours range from 2 to 15 hours per week.
- Exam scores range from 50 to 100 out of 100.
- Calculating Correlation:
- The teacher calculates the Pearson correlation coefficient and finds
.
- The teacher calculates the Pearson correlation coefficient and finds
Interpretation:
- Initial Conclusion:
- A correlation of 0.3 suggests a positive but weak linear relationship between study time and exam scores.
- The teacher might think that increasing study time has a modest effect on improving scores.
- Misinterpretation Risks:
- Assuming Causation:
- Believing that more study time directly causes higher scores without considering other factors.
- Ignoring Non-Linear Relationships:
- The relationship might be non-linear; perhaps beyond a certain number of study hours, additional time has diminishing returns.
- Underestimating Variability:
- A correlation of 0.3 means that only
of the variance in exam scores is explained by study time.
- A correlation of 0.3 means that only
- Alternative Analysis:
- Plotting the Data:
- A scatter plot might reveal a non-linear pattern or clusters.
- Considering Other Factors:
- Variables such as sleep, participation in class, or prior knowledge might influence exam scores.
- Using Rank Correlation:
- Calculating Spearman’s rank correlation might show a stronger monotonic relationship.
Explanation:
- Limitations of Pearson Correlation:
- The low correlation coefficient indicates that study time alone does not strongly predict exam scores.
- The relationship may be influenced by other variables or be non-linear.
- Better Approach:
- Use multiple regression analysis to account for additional factors.
- Consider non-linear models or transformations of the data.
- Use measures that capture non-linear dependencies.
Conclusion and Practical Takeaways
- Critical Evaluation of Correlation:
- Be cautious when interpreting correlation coefficients, especially in fat-tailed environments.
- Recognize that correlation does not imply causation.
- Beyond Linear Relationships:
- Explore alternative measures of dependence that capture non-linear and complex relationships.
- Use graphical analyses to identify patterns not evident in correlation coefficients.
- Risk Management Implications:
- In finance and other fields, understand that correlations can change during extreme events.
- Prepare for increased dependencies during crises.
- Continuous Learning:
- Stay informed about statistical tools and their appropriate applications.
- Be open to using advanced methods when traditional measures are inadequate.
By appreciating the limitations of correlation in capturing relationships between variables, especially in environments prone to extreme events and non-linear dependencies, analysts and decision-makers can avoid pitfalls and develop more robust models. This understanding enhances the ability to make informed decisions based on a comprehensive analysis of the data.
7. Shadow Mean and Underestimation of True Risks
Accurately assessing risk is essential in fields like finance, insurance, and public policy. In environments characterized by fat-tailed distributions, traditional statistical measures often underestimate the true risks because they fail to account for rare but extreme events. Nassim Taleb introduces the concept of the Shadow Mean to address this underestimation, emphasizing the need to consider unobserved extreme events in risk calculations.
Properties of Fat-Tailed Distributions
In fat-tailed distributions:
- Slow Convergence of the Mean:
- The Law of Large Numbers applies slowly.
- The sample mean converges to the true mean only with an impractically large sample size.
- Infinite or Undefined Moments:
- For distributions with a tail exponent
, the mean is infinite.
- For
, the variance is infinite.
- For distributions with a tail exponent
- Dominance of Extreme Events:
- A significant portion of the total impact comes from rare, extreme events.
- These events may not appear in finite samples.
The Shadow Mean Concept
Definition:
- The Shadow Mean is an adjusted estimate that accounts for the potential impact of unobserved extreme events.
- It acknowledges that in fat-tailed environments, the observed mean (

) is likely to be lower than the true mean (

).
Mathematical Representation:
- Observed Mean (
):
- Calculated from available sample data.
- True Mean (
):
- The actual average considering the entire distribution, including extreme events.
- Underestimation:

in fat-tailed distributions.
Estimating the Tail Exponent (
- Hill Estimator:

Where:


Implications for Risk Estimation
- Underestimated Risks:
- Relying on historical data without accounting for the shadow mean leads to underpreparedness for extreme events.
- Illusion of Stability:
- Absence of extreme events in the sample creates a false sense of security.
- Risk Measures:
- Traditional measures like Value at Risk (VaR) and Expected Shortfall (ES) may be significantly underestimated.
Practical Applications
1: Financial Markets:
- Portfolio Risk:
- Standard models may not account for rare market crashes.
- The shadow mean adjusts expectations for potential extreme losses.
2: Insurance and Reinsurance:
- Catastrophe Insurance:
- Premiums must consider the potential for unobserved extreme losses.
- The shadow mean helps in setting aside adequate reserves.
3: Public Policy and Infrastructure Planning:
- Disaster Preparedness:
- Planning must account for events beyond historical records.
- The shadow mean informs resource allocation for emergencies.
Hypothetical Scenario Illustrating the Concept
Scenario: Estimating Average Flood Damage
Imagine a city council is assessing the average annual damage from floods to plan its infrastructure budget.
- Data Collected:
- Over the past 20 years, annual flood damage has ranged from $1 million to $10 million.
- The observed average damage is $5 million per year.
- Missing Information:
- Historical records do not include a catastrophic flood, which could cause $100 million in damage.
- Such an event might occur once every 100 years.
Analysis:
- Observed Mean:
- Based on the 20-year data, the average is $5 million.
- Potential Underestimation:
- The sample lacks data on extreme, rare floods.
- The distribution of flood damage is fat-tailed.
Applying the Shadow Mean:
- Estimating the Tail Exponent (
- Use the largest observed damages to estimate
- Use the largest observed damages to estimate
- Adjusting the Mean:
- Incorporate the potential impact of the rare catastrophic flood.
- The shadow mean might increase the estimated average damage to, say, $15 million.
Implications:
- Budget Planning:
- The city should allocate more funds for flood prevention and emergency response.
- Risk Management:
- Underestimating true average damage could leave the city unprepared for a disaster.
- Policy Decisions:
- Implement stricter building codes and invest in flood mitigation infrastructure.
Conclusion and Practical Takeaways
- Accounting for Extreme Events:
- In fat-tailed environments, it’s crucial to consider rare but impactful events.
- The shadow mean provides a more accurate risk assessment.
- Risk Management Strategies:
- Prepare for worst-case scenarios, not just what’s been observed.
- Allocate resources to mitigate potential extreme losses.
- Continuous Monitoring and Updating:
- Regularly update risk estimates as new data becomes available.
- Reassess the tail exponent and adjust plans accordingly.
By incorporating the concept of the shadow mean into risk assessments, organizations and policymakers can better anticipate and prepare for extreme events. This approach ensures a realistic understanding of potential risks and promotes strategies that enhance resilience against unforeseen catastrophes.
8. Survival and Precautionary Principle
Understanding and managing risk is essential when dealing with uncertainties that could lead to catastrophic outcomes. Nassim Taleb emphasizes the importance of the Precautionary Principle, especially in environments characterized by fat-tailed distributions, where extreme events are more likely and can have irreversible consequences. This principle advocates for preventive action when an activity poses a risk of significant harm, even if some cause-and-effect relationships are not fully established scientifically.
Characteristics of Fat-Tailed Risks
In fat-tailed distributions:
- High Impact of Extreme Events:
- Rare events can have disproportionately large effects.
- The consequences may be catastrophic and irreversible.
- Unpredictability:
- Precise probabilities of extreme events are often unknown or underestimated.
- Traditional risk assessment models may fail to capture the true likelihood and impact.
- Non-Linearity and Interdependence:
- Small actions can trigger massive, unforeseen reactions due to interconnected systems.
Mathematical Representation of Catastrophic Risk
- Probability of Catastrophic Event Over Time:
where:is the cumulative probability of a catastrophic event occurring over time
.
- Interpretation:
- Even with a small
approaches 1.
- Over a long enough period, the occurrence of a catastrophic event becomes almost certain.
- Even with a small

Application of the Precautionary Principle
Non-Naive Approach:
- Focus on Actions with Irreversible Consequences:
- Prioritize preventing events that can cause widespread, irreversible harm.
- Avoid Overgeneralization:
- Do not apply the principle to trivial risks or hinder beneficial innovation unnecessarily.
Examples:
1: Genetically Modified Organisms (GMOs):
- Risk:
- Releasing GMOs into the environment may disrupt ecosystems in unforeseen ways.
- Potential for crossbreeding with wild species, leading to loss of biodiversity.
- Application:
- Exercise caution in deploying GMOs until long-term ecological impacts are better understood.
2: Artificial Intelligence (AI):
- Risk:
- Uncontrolled AI development could lead to unintended, harmful behaviors.
- Possibility of AI systems causing widespread disruption.
- Application:
- Implement regulations and oversight to ensure AI development aligns with ethical standards and safety protocols.
3: Pandemics and Pathogen Research:
- Risk:
- Research involving dangerous pathogens could lead to accidental releases.
- Global health crises may result from such incidents.
- Application:
- Enforce strict safety measures in laboratories.
- Limit certain types of research that pose high risks without clear benefits.
Risk Management Strategies
- Robustness Over Optimization:
- Design systems to withstand shocks rather than just optimizing for efficiency.
- Build redundancy and buffers to absorb unexpected events.
- Monitoring and Adaptive Management:
- Continuously assess risks and update strategies based on new information.
- Be prepared to change course if emerging evidence indicates increased risk.
- Regulation and Oversight:
- Implement policies that prevent high-risk activities from proceeding unchecked.
- Promote transparency and accountability in industries that could pose catastrophic risks.
Hypothetical Scenario Illustrating the Concept
Scenario: Releasing Experimental Algae into a Local Pond
Imagine your high school’s environmental science club is considering a project to improve the local pond’s ecosystem. You’ve developed a new type of fast-growing algae that could enhance oxygen levels in the water, potentially benefiting aquatic life.
Potential Benefits:
- Increased oxygenation might support more fish and plant species.
- The project could provide valuable data on ecosystem enhancement.
Potential Risks:
- The algae could grow uncontrollably, outcompeting native species.
- It might deplete nutrients, leading to the collapse of the pond’s ecosystem.
- The algae could spread to other water bodies, causing broader environmental damage.
Decision Using the Precautionary Principle:
- Assessment:
- Recognize that introducing a non-native organism carries significant ecological risks.
- Understand that once released, the algae cannot be easily removed if problems arise.
- Action:
- Decide not to release the experimental algae into the pond.
- Explore alternative projects that do not pose such irreversible risks.
Explanation:
Even though the project aims to improve the ecosystem and provide educational opportunities, the potential for causing irreversible environmental harm is too great. Applying the precautionary principle, the club prioritizes the long-term health of the ecosystem over the uncertain benefits of the experiment.
Conclusion and Practical Takeaways
- Prioritize Survival and System Integrity:
- When actions carry the risk of catastrophic, irreversible damage, it’s essential to err on the side of caution.
- Critical Evaluation of Risks:
- Assess not just the probability but also the potential severity of negative outcomes.
- Recognize that in fat-tailed environments, unlikely events can have devastating impacts.
- Responsible Innovation:
- Encourage progress while ensuring safety and sustainability are not compromised.
- Implement safeguards and thorough testing before introducing new technologies or organisms into the environment.
- Policy and Governance Implications:
- Develop regulations that prevent high-risk activities without stifling beneficial innovation.
- Promote interdisciplinary collaboration to fully understand the potential impacts of new developments.
By embracing the precautionary principle in the face of uncertainty—especially in fat-tailed domains—individuals, organizations, and governments can better safeguard against catastrophic outcomes. This approach emphasizes the importance of long-term survival and the responsibility to prevent actions that could cause irreversible harm to society or the environment.
Quiz
#1: What is the main difference between thin-tailed (Mediocristan) and fat-tailed (Extremistan) distributions in terms of extreme events?
Answer:
In thin-tailed distributions (Mediocristan), extreme events are rare and have minimal impact on the overall system. In fat-tailed distributions (Extremistan), extreme events are more probable and can have a disproportionately large impact on the system.#2: Why are traditional statistical measures like mean and variance reliable in Mediocristan but not in Extremistan?
Answer:
In Mediocristan, data clusters around the mean, and extreme values are rare and bounded, making mean and variance reliable descriptors. In Extremistan, extreme values (outliers) can significantly skew these measures, making them unreliable because outliers can dominate the dataset.#3: Provide an example of a variable from Mediocristan and one from Extremistan.
Answer:
Example from Mediocristan: Human height, which is naturally bounded and doesn’t vary drastically. Example from Extremistan: Wealth distribution, where a small number of individuals can have extremely high wealth compared to the average.#4: What heuristic can help determine if a variable follows a thin-tailed distribution?
Answer:
If the variable is bounded by natural or physical limits (e.g., human height), suggesting that extreme values are impossible or highly unlikely, it likely follows a thin-tailed distribution.#5: Why might the absence of observed outliers not confirm a thin-tailed distribution?
Answer:
Because in fat-tailed distributions, extreme events are rare and may not appear in finite samples. Their absence doesn’t mean they can’t occur; it may simply be that they haven’t been observed yet.#6: Explain how multiplicative processes can lead to fat-tailed distributions.
Answer:
Multiplicative processes involve variables that can scale exponentially or have positive feedback loops, allowing values to grow without strict upper limits, which results in fat-tailed distributions where extreme values are possible. #7: What does a smaller tail exponent (
Answer:
A smaller tail exponent ( closer to 1) indicates a fatter tail, meaning that extreme events are more probable and have a greater impact on the distribution. #8: In the context of wealth distribution, what does a power-law distribution with a low
Answer:
It implies significant inequality, where a small percentage of the population holds a large portion of the total wealth, and extreme wealth values are more common than they would be in a thin-tailed distribution. #9: Why is estimating the tail exponent (
Answer:
Estimating is challenging due to data limitations like finite samples that may not capture extreme events, measurement errors, and methodological variability, including subjective choices like the threshold where the power-law behavior starts.#10: What is one major limitation of traditional forecasting models in financial markets, according to Taleb?
Answer:
They often assume a Gaussian distribution of returns, underestimating the probability and impact of extreme market movements, which can lead to significant underestimation of risk in fat-tailed environments like financial markets.#11: How does tail hedging help in risk management?
Answer:
Tail hedging involves acquiring financial instruments like deep out-of-the-money options that provide large payoffs during extreme market movements, thereby protecting portfolios against significant losses during rare but severe events.#12: What is a challenge associated with implementing tail hedging strategies?
Answer:
Tail hedging can involve ongoing costs that reduce short-term returns, and there may be institutional constraints or behavioral biases that discourage investors from adopting these strategies despite their long-term benefits.#13: According to prospect theory, how do people generally perceive gains and losses?
Answer:
People are typically risk-averse with gains (preferring certain gains over risky ones) and risk-seeking with losses (willing to take risks to avoid certain losses). They also experience losses more intensely than equivalent gains (loss aversion).#14: What is Taleb’s critique regarding the application of behavioral economics in fat-tailed environments?
Answer:
Taleb argues that behavioral economics often assumes known probabilities and ignores the impact of extreme events in fat-tailed distributions, leading to models that underestimate risks and fail to prioritize long-term survival over short-term gains.#15: Why is focusing on survival and avoiding ruin rational in fat-tailed contexts?
Answer:
Because in fat-tailed contexts, extreme events can lead to catastrophic losses that are irreversible. Prioritizing survival ensures long-term success and avoids strategies that could result in ruin, even if they offer favorable short-term expected returns.#16: Why might the Pearson correlation coefficient be misleading in fat-tailed environments?
Answer:
Because it only measures linear relationships and is sensitive to outliers, which are more frequent in fat-tailed distributions. Extreme values can distort the correlation coefficient, making it unreliable for capturing the true relationship between variables.#17: What is mutual information, and why is it useful in fat-tailed contexts?
Answer:
Mutual information is a measure from information theory that quantifies the amount of information one random variable contains about another, capturing both linear and non-linear dependencies. It is useful in fat-tailed contexts because it is sensitive to any statistical dependence, not just linear relationships.#18: How can reliance on correlation coefficients lead to underestimating joint risks?
Answer:
If assets are assumed to be uncorrelated based on low correlation coefficients, their joint risk may be underestimated. In extreme events, assets can become highly correlated, leading to simultaneous losses that were not anticipated by models relying solely on correlation.#19: What is the ‘Shadow Mean’ in the context of fat-tailed distributions?
Answer:
The Shadow Mean is an adjusted estimate of the true mean that accounts for the potential impact of unobserved extreme events. It acknowledges that the sample mean may be biased downward in fat-tailed contexts due to the absence of rare but significant events in finite samples.#20: Why does the sample mean often underestimate the true mean in fat-tailed distributions?
Answer:
Because extreme events, which can significantly increase the mean, are rare and may not be captured in finite samples. As a result, the sample mean does not reflect their impact, leading to an underestimation of the true mean.#21: How does the Hill estimator help in adjusting for the shadow mean?
Answer:
The Hill estimator is used to estimate the tail exponent () of a distribution, which characterizes the heaviness of the tail. By estimating , we can adjust the mean to account for the potential impact of unobserved extreme events, thereby calculating the shadow mean.#22: What does the Precautionary Principle advocate for in the face of uncertainty?
Answer:
It advocates for preventive action when an activity poses a risk of significant or irreversible harm, even if some cause-and-effect relationships are not fully established scientifically. It emphasizes caution in the face of uncertainty, especially with potential catastrophic outcomes.#23: Why is the Precautionary Principle particularly important in fat-tailed environments?
Answer:
Because in fat-tailed environments, extreme events are more likely and can have catastrophic, irreversible consequences. The principle helps prevent actions that could trigger such events, prioritizing long-term survival and system integrity over short-term benefits.#24: Give an example of applying the Precautionary Principle in a real-world context.
Answer:
An example is exercising caution in the release of genetically modified organisms (GMOs) into the environment. Since the long-term ecological impacts are uncertain and could be irreversible, the Precautionary Principle would advocate for thorough testing and regulations before widespread release.Provide 30 discussion questions relevant to the content above.
Thin Tails vs. Fat Tails
- What are the key differences between thin-tailed and fat-tailed distributions, and how do they impact our understanding of risk?
- How does the concept of Mediocristan vs. Extremistan help in identifying the nature of a dataset?
- Can you provide real-world examples where misidentifying a fat-tailed distribution as thin-tailed led to significant consequences?
Heuristics for Determining Distribution Type
- What heuristics can be used to determine whether a variable follows a thin-tailed or fat-tailed distribution?
- How do physical and biological constraints influence the type of distribution a variable might follow?
- Why is it important to consider domain knowledge and underlying mechanisms when analyzing data distributions?
Power Laws and Tail Exponents
- What is the significance of the tail exponent in a power-law distribution, and how does it affect the probability of extreme events?
- How do power-law distributions manifest in different fields, such as finance or natural disasters?
- What challenges are associated with estimating the tail exponent, and how can these challenges impact risk assessment?
Forecasting and Risk Management
- Why do traditional forecasting models often fail in fat-tailed environments, and what are the implications for risk management?
- How does tail hedging work, and in what situations might it be an effective strategy?
- What are some of the challenges or drawbacks associated with implementing tail hedging strategies?
Errors in Behavioral Economics
- How does prospect theory explain human behavior under risk, and what are its limitations in fat-tailed contexts?
- What is the concept of ergodicity, and why is it important when considering repeated exposure to risk?
- How might overemphasis on expected utility lead to decisions that ignore catastrophic risks?
Misunderstanding of Probability and Correlation
- Why might the Pearson correlation coefficient be misleading in certain contexts, especially in fat-tailed distributions?
- How can alternative measures, like mutual information or rank correlation coefficients, provide a better understanding of dependencies?
- What are the implications of misinterpreting correlation for decision-making and risk assessment?
Shadow Mean and Underestimation of True Risks
- What is the shadow mean, and how does it address the limitations of traditional mean estimates in fat-tailed distributions?
- How can underestimating the true mean impact financial planning or policy-making?
- What methods can be used to adjust for the potential impact of unobserved extreme events?
Survival and the Precautionary Principle
- What is the precautionary principle, and why is it particularly relevant in fat-tailed environments?
- How does prioritizing survival over short-term gains influence decision-making in high-stakes situations?
- Can you discuss a scenario where applying the precautionary principle might prevent a catastrophic outcome?
Interdisciplinary Applications
- How can the concepts discussed (fat tails, power laws, risk management) be applied across different disciplines such as ecology, epidemiology, or technology?
- In what ways might professionals in various fields misinterpret statistical data due to a lack of understanding of distribution types?
- How can education on these statistical concepts improve policy-making and strategic planning?
Ethical Considerations
- What ethical responsibilities do decision-makers have when dealing with potential extreme risks in fat-tailed environments?
- How should organizations balance innovation with caution to prevent possible catastrophic outcomes?
- Discuss the role of transparency and communication in managing public perception of risks associated with extreme events.
Statistical Modeling and Limitations
- What are the limitations of using standard deviation as a measure of risk in fat-tailed distributions?
- How can models be adjusted or designed to better account for the probability of extreme events?
- What role does statistical education play in preventing misapplication of models in real-world scenarios?
Historical Examples
- Can you identify historical events where failure to recognize fat-tailed risks led to significant losses or disasters?
- How have past financial crises highlighted the limitations of traditional risk models?
- What lessons can be learned from these events to improve future risk management practices?
Personal Decision-Making
- How might an individual’s understanding of fat-tailed risks influence their personal financial or life decisions?
- In what ways can individuals apply the precautionary principle in everyday situations?
- Discuss how awareness of cognitive biases can improve personal decision-making under uncertainty.
Communication of Risk
- What challenges exist in communicating complex statistical concepts like fat-tailed risks to non-experts?
- How can policymakers and experts effectively convey the importance of preparing for extreme events to the public?
- Discuss strategies for improving public understanding of risk and uncertainty.
Future Implications
- With increasing interconnectedness and complexity in global systems, how might fat-tailed risks evolve in the future?
- What role does technology play in both mitigating and exacerbating fat-tailed risks?
- How can societies build resilience against potential extreme events in the coming decades?
Table of Contents: (Click any link below to navigate to that section.)
- Provide the key take-aways from the following interview:
- 1. Thin Tails vs. Fat Tails (Mediocristan vs. Extremistan)
- 2. Heuristics for Determining Distribution Type
- 3. Power Laws and Tail Exponents
- 4. Forecasting and Risk Management
- 5. Errors in Behavioral Economics
- 6. Misunderstanding of Probability and Correlation
- 7. Shadow Mean and Underestimation of True Risks
- 8. Survival and Precautionary Principle
- Quiz
- Provide 30 discussion questions relevant to the content above.


Leave a comment