


- “…the bimodal distribution in the chart suggests two distinct peaks… two prevalent scores where students’ grades are clustering.”
- “…Different Levels of Preparation: One group of students might have been better prepared…while another group was less prepared, resulting in a cluster of lower scores.”
- “…Different Teaching Methods or Curricula: If the chart represents the grades from two different classes…this could account for the two peaks.”
- “…Varied Difficulty in Test Sections: The test may have had sections of varying difficulty, leading students to perform well in one section and poorly in another.”
- “…Cheating or Collaborative Groups: If a subset of students cheated or worked together, their scores might cluster around a higher peak…”
- “…Technical Issues or Errors: There could be errors in the way the grades were recorded or inputted, resulting in an artificial bimodal distribution.”
- “…Natural Ability or Interest Levels: The subject might naturally separate students into those who have a strong ability or interest and those who do not…”
Table of Contents: (Click any link below to navigate to that section.)
- What are the possible reasons for the bimodal distribution in this chart?
- Provide 3 hypothetical cases in which a trimodal distribution might be found.
- After detecting a multi-modal distribution, what process can we use to explain the deviation from a normal bell curve?
- Create a 10-item quiz on the entire thread above.
- Provide 15 discussion questions relevant to the content above.


What are the possible reasons for the bimodal distribution in this chart?
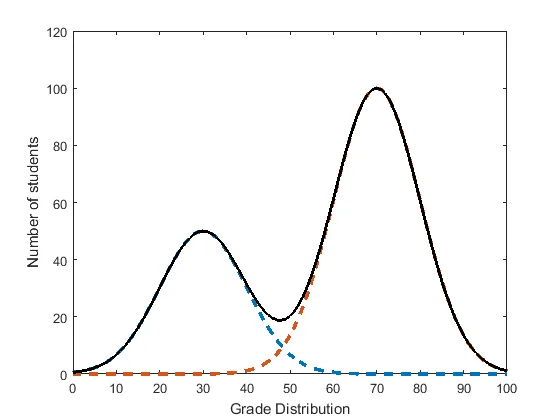
The bimodal distribution in the chart suggests two distinct peaks, which indicates that there are two prevalent scores where students’ grades are clustering. Several factors or scenarios could lead to such a distribution:
- Different Levels of Preparation: One group of students might have been better prepared for the test, leading to a high number of high scores, while another group was less prepared, resulting in a cluster of lower scores.
- Different Teaching Methods or Curricula: If the chart represents the grades from two different classes or groups taught by different instructors or using different curricula, this could account for the two peaks.
- Varied Difficulty in Test Sections: The test may have had sections of varying difficulty, with one set of questions being much harder than the other, leading students to perform well in one section and poorly in another.
- Cheating or Collaborative Groups: If a subset of students cheated or worked together, their scores might cluster around a higher peak, while the rest of the class who worked independently might form the lower peak.
- Technical Issues or Errors: There could be errors in the way the grades were recorded or inputted, resulting in an artificial bimodal distribution.
- Natural Ability or Interest Levels: The subject might naturally separate students into those who have a strong ability or interest and those who do not, leading to peaks at the higher and lower ends of the grade spectrum.
- External Factors: Events or circumstances outside the classroom, such as a major event that affected part of the student body, could lead to a bimodal distribution in performance.
The reasons behind the bimodal distribution could be further investigated by looking into the data collection methods, examining the test content, and understanding the student demographics and conditions during the test or course.
The bimodal (two-peaked) distribution observed in the chart could potentially be due to the data representing a mixture of two different underlying populations or groups.
Some possible explanations for a bimodal grade distribution include:
- The data may be combining grades from two different courses or subjects with different difficulty levels or grading standards, resulting in two distinct peaks.
- It could represent a combination of grades from two different instructors or grading methods, where one instructor/method tends to give higher grades, and the other gives lower grades on average.
- The data may be combining grades from two different academic years or semesters, where changes in the curriculum, teaching methods, or student population led to a shift in the grade distribution.
- It could also arise from a mixed population of students, such as combining grades from undergraduate and graduate students, or from students in different majors or programs with varying levels of preparation or aptitude.
- In some cases, a bimodal distribution can also result from a non-linear grading scheme, where a certain range of scores is assigned one grade, and another range is assigned a different grade, creating two distinct peaks.
Without additional context or information about the data source, it is difficult to pinpoint the exact reason for the bimodal pattern. However, the presence of two distinct peaks in the grade distribution suggests a heterogeneous population or a mixture of two different subgroups or processes influencing the grades.
Provide 3 hypothetical cases in which a trimodal distribution might be found.
A trimodal distribution is characterized by three prominent peaks in the data, indicating the presence of three different groups or factors that lead to distinct concentrations of data points. Here are three hypothetical scenarios that could result in a trimodal distribution:
- Academic Performance Across Three Different Teaching Methods:
- Scenario: A large school conducts an experiment to compare the effectiveness of three different teaching methods for a mathematics course: traditional lectures, blended learning, and self-paced online instruction.
- Data Collection: Students are randomly assigned to one of the three teaching methods. At the end of the semester, their performance is assessed through a standardized test.
- Expected Distribution: The final grade distribution could be trimodal if each teaching method leads to a distinct performance cluster. For instance, students in the traditional lecture might cluster around a median score, students in the blended learning environment might have either very high or moderate scores due to the mixed approach, and students using self-paced online instruction might fall into a lower performance cluster if they lacked discipline or guidance.
- Product Sales in Three Distinct Market Segments:
- Scenario: A company sells a health and wellness product that appeals to three distinct market segments: young adults, middle-aged parents, and seniors.
- Data Collection: The company collects data on the number of products sold in each segment over a quarter.
- Expected Distribution: A trimodal distribution might emerge if each segment shows a preference for purchasing the product at different rates. Young adults may purchase the product infrequently, middle-aged parents may purchase it regularly for their families, and seniors might buy it in large quantities due to health consciousness, leading to three peaks in the sales distribution.
- Employee Satisfaction Across Three Company Branches:
- Scenario: A multinational company with branches in Asia, Europe, and North America conducts an employee satisfaction survey.
- Data Collection: Employees rate their satisfaction on a scale from 0 (completely dissatisfied) to 100 (completely satisfied).
- Expected Distribution: If the working conditions, cultural aspects, and management styles differ significantly among the branches, the satisfaction scores could form a trimodal distribution. For example, Asian branch employees might have a moderate satisfaction score due to a balance between work and life, European branch employees might have high satisfaction scores due to favorable labor laws and work culture, while North American branch employees might show lower satisfaction scores due to a highly competitive work environment.
In each case, rigor in data collection and analysis is crucial to determine the reasons behind the trimodal distribution. Careful design of the study, including control for confounding variables, is essential to interpret the results accurately.
A trimodal distribution, which exhibits three distinct peaks in the data, can arise in various hypothetical scenarios. Here are three cases where a trimodal distribution might be observed, along with detailed explanations:
Case 1: A combination of three distinct grading systems or assessment methods.
In an educational setting, a trimodal grade distribution could occur when the grades are aggregated from three different sources that use distinct grading systems or assessment methods. For example:
- One-third of the grades come from a traditional letter grade system (A, B, C, D, F) with a bell-curve distribution.
- Another third of the grades are based on a competency-based grading system, where students are evaluated on specific skills and receive either a “mastery” or “non-mastery” grade, resulting in a bimodal distribution.
- The remaining third of the grades are from a project-based assessment system, where students receive grades based on their project performance, which may follow a different distribution pattern.
When these three distinct grading systems are combined, the resulting grade distribution could exhibit three peaks, reflecting the different grading philosophies and evaluation methods.
Case 2: A mixture of three distinct student populations or academic programs.
In a university setting, a trimodal grade distribution could arise when the data combines grades from three distinct student populations or academic programs with varying levels of academic preparedness or rigor. For instance:
- One peak could represent grades from students in a highly selective honors program, where the admission criteria and academic standards are stringent, resulting in a concentration of high grades.
- Another peak could correspond to grades from students in a standard undergraduate program, with a broader range of academic abilities and a more typical bell-curve distribution.
- The third peak could represent grades from students in a remedial or developmental program, where the academic preparation and performance levels may be lower, resulting in a concentration of lower grades.
The combination of these three distinct student populations, each with its own academic profile and grading distribution, could lead to a trimodal pattern in the overall grade distribution.
Case 3: A combination of three different assessment components or grading criteria.
In certain academic or professional settings, the overall grade or performance evaluation may be based on three distinct components or criteria, each with its own distribution pattern. For example:
- One component could be a standardized test or exam, which typically follows a bell-curve distribution.
- Another component could be a project or portfolio assessment, where the grades may be skewed towards either high or low scores, depending on the difficulty and rubric used.
- The third component could be a peer or self-evaluation, which may exhibit a bimodal distribution, with students either rating themselves or their peers highly or poorly.
When these three assessment components are combined to determine the final grade or performance evaluation, the resulting distribution could exhibit a trimodal pattern, reflecting the distinct distributions of each component.
In each of these hypothetical cases, the trimodal distribution arises from the combination or mixture of three distinct subgroups, grading systems, or assessment components, each with its own unique distribution pattern. The presence of three peaks in the overall distribution reflects the underlying heterogeneity or diversity within the data, and can provide insights into the different processes or factors influencing the observed outcomes.
After detecting a multi-modal distribution, what process can we use to explain the deviation from a normal bell curve?
When a multi-modal distribution is detected, especially one that deviates from the expected normal bell curve, the following process can be employed to investigate and explain the deviation:
- Data Verification:
- Initial Step: Ensure that the data has been collected and recorded correctly without any errors that could create artificial peaks in the distribution.
- Consistency Checks: Review the data entry process, confirm the scale and units used, and look for any signs of duplication or omission.
- Descriptive Analysis:
- Examine Data Properties: Look at measures of central tendency (mean, median, mode) and dispersion (range, variance, standard deviation) for the overall data and within each peak.
- Graphical Representation: Use histograms, box plots, and frequency polygons to visualize the distribution and identify the locations of the modes.
- Segmentation Analysis:
- Identify Subgroups: Determine if there are logical subgroupings within the data that could explain the multiple modes (e.g., age groups, different classes, time periods).
- Controlled Comparisons: Compare the subgroups against each other on relevant variables to understand the characteristics of each mode.
- Investigation of External Factors:
- Contextual Factors: Investigate any external factors or events that could have influenced the data (e.g., changes in policy, environmental factors, social events).
- Stakeholder Interviews: Gather qualitative information from people involved (like teachers, students, employees) that could explain variations.
- Statistical Analysis:
- Hypothesis Testing: Formulate and test hypotheses that might explain the multi-modal nature of the data (e.g., two teaching methods lead to different performance outcomes).
- Advanced Modeling: Use statistical models such as mixture models or cluster analysis to identify and model the different distributions within the data.
- Internal Consistency Checks:
- Reliability Analysis: If the data is from a survey or test, perform a reliability analysis to ensure the consistency of the measurement instrument.
- Item Analysis: For test scores, analyze individual items to see if certain questions were bimodal or trimodal themselves, indicating varying difficulty levels.
- Review of Literature and Benchmarks:
- Comparative Analysis: Compare with existing literature or benchmarks to understand if the observed distribution is an anomaly or a known phenomenon in the field.
- Theoretical Frameworks: Consider theoretical frameworks that might predict or explain the observed distribution pattern.
- Iterative Exploration:
- Iterative Refinement: Refine the analysis as new insights are gained. The process is often not linear and requires going back and forth between steps.
- Multiple Hypotheses: Be open to multiple explanations and investigate the data from various angles.
- Reporting and Documentation:
- Comprehensive Reporting: Document all findings, methodologies, and analyses clearly.
- Peer Review: If possible, have the analysis reviewed by peers for objectivity and to gain different perspectives.
- Action and Application:
- Implications: Consider the practical implications of the findings for the field or application.
- Recommendations: Based on the insights gained, make informed recommendations for changes, interventions, or further research.
By following these steps, one can systematically investigate the reasons behind a multi-modal distribution and provide a comprehensive explanation for the deviation from a normal distribution.
When a multi-modal distribution is observed, deviating from the expected normal bell curve, there are several processes and techniques that can be employed to investigate and explain the underlying causes. Here are some common approaches:
- Mixture Modeling:
Mixture modeling is a statistical technique used to identify and model the presence of heterogeneous subpopulations within a dataset. It assumes that the overall distribution is a mixture of two or more distinct component distributions, each representing a different subgroup or process.
The process involves fitting a mixture model to the data, which estimates the parameters (e.g., means, variances, and mixing proportions) of the component distributions. By analyzing these parameters, researchers can gain insights into the characteristics and relative contributions of the different subpopulations or processes that give rise to the multi-modal distribution.
- Cluster Analysis:
Cluster analysis is a data mining technique used to group similar observations or data points into distinct clusters based on their characteristics or patterns. In the context of multi-modal distributions, cluster analysis can be employed to identify and separate the different modes or peaks in the data.
Various clustering algorithms, such as k-means, hierarchical clustering, or density-based clustering, can be used to partition the data into distinct clusters, each potentially representing a different subpopulation or process contributing to the overall multi-modal distribution.
- Exploratory Data Analysis (EDA):
Exploratory data analysis involves a systematic approach to understanding and visualizing the underlying patterns and characteristics of the data. In the case of multi-modal distributions, EDA techniques can help identify potential subgroups or factors that may be driving the observed deviations from normality.
This can involve examining various data attributes, such as categorical variables (e.g., demographics, groups, treatments), or identifying potential outliers or extreme values that may be influencing the distribution shape. Visualization tools like histograms, kernel density plots, and scatter plots can aid in this exploratory process.
- Subject Matter Expertise and Domain Knowledge:
In many cases, the multi-modal distribution may be attributable to known or hypothesized factors specific to the domain or context of the data. Subject matter experts or domain knowledge can provide valuable insights into potential subpopulations, processes, or mechanisms that could be contributing to the observed distribution patterns.
By leveraging this domain expertise, researchers can formulate hypotheses and test them against the data, potentially uncovering the underlying causes of the multi-modal distribution.
- Sensitivity Analysis and Simulation:
When the causes of a multi-modal distribution are not immediately apparent, sensitivity analysis and simulation techniques can be employed to explore the impact of various factors or assumptions on the resulting distribution shape.
By systematically varying input parameters, researchers can observe how the distribution changes and identify potential tipping points or combinations of factors that may lead to multi-modality. This iterative process can help unveil the underlying mechanisms and interactions contributing to the observed deviations from normality.
It is important to note that these processes are often used in combination, as multi-modal distributions can arise from complex interactions of multiple factors. Additionally, domain-specific knowledge and subject matter expertise play a crucial role in interpreting the results and providing meaningful explanations for the observed deviations from the normal bell curve.
Create a 10-item quiz on the entire thread above.
Certainly, here’s a 10-item quiz based on the previous discussion.
Quiz
- What does a bimodal distribution indicate in a dataset?
- Name one educational factor that could lead to a bimodal distribution of grades among students.
- Provide one potential reason for the presence of a bimodal distribution due to test structure.
- What could a trimodal distribution in data signify?
- Describe a scenario that might result in a trimodal distribution regarding teaching methods.
- How might a company’s sales data show a trimodal distribution based on market segments?
- What initial step should be taken when a multi-modal distribution is detected in a dataset?
- What type of graphical representation can be used to visualize the distribution of data and identify modes?
- Which statistical technique can be used to model different distributions within data when investigating a multi-modal distribution?
- Why is it important to conduct a reliability analysis on the data from a survey or test?
Answers
- The presence of two distinct groups or factors leading to concentrations of data points at two separate points.
- Different teaching methods or curricula.
- Varied difficulty in test sections that result in students performing well in one section and poorly in another.
- The presence of three distinct groups or factors leading to concentrations of data points at three separate points.
- A school experimenting with three different teaching methods, such as traditional lectures, blended learning, and self-paced online instruction, may lead to a trimodal distribution in students’ performance.
- Different purchase rates of a product by young adults, middle-aged parents, and seniors could result in a trimodal distribution in sales data.
- Verify that the data has been collected and recorded correctly.
- Histograms, box plots, or frequency polygons.
- Mixture models or cluster analysis.
- To ensure the consistency of the measurement instrument and the validity of the data analysis.
- Which of the following is a potential reason for a bimodal distribution in a grade distribution chart?
A. The data represents a mixture of two different courses or subjects with different difficulty levels.
B. The data combines grades from two different academic years or semesters.
C. The data includes grades from two different instructors or grading methods.
D. All of the above. - In a hypothetical case, a trimodal distribution in grades could arise from:
A. A combination of three distinct grading systems or assessment methods.
B. A mixture of three distinct student populations or academic programs.
C. A combination of three different assessment components or grading criteria.
D. All of the above. - Which of the following is NOT a process or technique mentioned for explaining deviations from a normal bell curve distribution?
A. Mixture modeling
B. Cluster analysis
C. Regression analysis
D. Exploratory data analysis (EDA) - Sensitivity analysis and simulation techniques can be used to:
A. Identify potential subpopulations or processes contributing to a multi-modal distribution.
B. Explore the impact of various factors or assumptions on the resulting distribution shape.
C. Partition the data into distinct clusters representing different modes or peaks.
D. Fit a mixture model to the data to estimate the parameters of component distributions. - Which of the following is NOT mentioned as a potential component contributing to a trimodal grade distribution in a hypothetical case?
A. Grades from a traditional letter grade system
B. Grades from a competency-based grading system
C. Grades from a project-based assessment system
D. Grades from a peer-evaluation system - In the context of multi-modal distributions, what is the purpose of cluster analysis?
A. To identify and separate the different modes or peaks in the data.
B. To estimate the parameters of component distributions within a mixture model.
C. To explore the impact of various factors on the distribution shape.
D. To assess the normality of the distribution. - Which of the following is NOT a potential approach mentioned for investigating the causes of multi-modal distributions?
A. Mixture modeling
B. Cluster analysis
C. Regression analysis
D. Exploratory data analysis (EDA) - Subject matter expertise and domain knowledge can be valuable in:
A. Formulating hypotheses and testing them against the data.
B. Identifying potential subpopulations, processes, or mechanisms contributing to the distribution patterns.
C. Interpreting the results and providing meaningful explanations for the observed deviations.
D. All of the above. - Which of the following is a potential assessment component or grading criteria that could contribute to a trimodal grade distribution in a hypothetical case?
A. Standardized test or exam
B. Project or portfolio assessment
C. Peer or self-evaluation
D. All of the above - In the context of multi-modal distributions, what is the purpose of mixture modeling?
A. To identify and model the presence of heterogeneous subpopulations within a dataset.
B. To partition the data into distinct clusters based on their characteristics or patterns.
C. To systematically vary input parameters to observe the impact on the distribution shape.
D. To visualize the underlying patterns and characteristics of the data.
Answers:
- D
- D
- C
- B
- D
- A
- C
- D
- D
- A
Provide 15 discussion questions relevant to the content above.
- How does a bimodal distribution differ from a normal distribution, and what insights can it provide about a dataset?
- What implications might a bimodal grade distribution have for a teacher’s approach to instruction?
- Discuss how a bimodal distribution could indicate the need for differentiated instruction in a classroom setting.
- Can a bimodal distribution in test scores suggest anything about student engagement or motivation levels?
- In what ways could the testing environment contribute to a bimodal distribution of scores?
- Explore how socioeconomic factors might lead to a bimodal distribution in educational achievement.
- What strategies could be employed to analyze a dataset that shows a trimodal distribution?
- Discuss the potential impact of cultural differences on a trimodal distribution of employee satisfaction survey results.
- How might the introduction of a new teaching method be reflected in the grade distribution of a class?
- What are the challenges in interpreting a multi-modal distribution in sales data across different market segments?
- Discuss the importance of data verification when a multi-modal distribution is detected.
- How could the design of a survey influence the distribution of responses and potentially lead to multi-modality?
- In what ways can advanced statistical models, like mixture models, help in understanding complex datasets with multiple peaks?
- Discuss the ethical considerations when investigating a suspected case of cheating that might have caused a bimodal distribution in test scores.
- How does the iterative nature of data analysis contribute to understanding and explaining deviations from a normal distribution?
Here are 15 discussion questions relevant to the content on multi-modal distributions and explaining deviations from a normal bell curve:
- What are some real-world examples of datasets that might exhibit bimodal or multi-modal distributions, and what could be the potential reasons for such distributions?
- How can mixture modeling techniques be applied to identify and model the presence of heterogeneous subpopulations within a dataset? What are the advantages and limitations of this approach?
- Discuss the role of cluster analysis in understanding multi-modal distributions. What are the different clustering algorithms that can be used, and how do they differ in their approach and suitability for different types of data?
- How can exploratory data analysis (EDA) techniques, such as visualization and data summarization, aid in identifying potential subgroups or factors contributing to multi-modal distributions?
- In what scenarios might subject matter expertise and domain knowledge be particularly valuable in interpreting and explaining the causes of multi-modal distributions?
- Discuss the potential benefits and drawbacks of using sensitivity analysis and simulation techniques to explore the impact of various factors or assumptions on the resulting distribution shape.
- How might the choice of assessment methods or grading criteria in an educational setting contribute to the emergence of multi-modal distributions in student grades?
- In the context of a trimodal grade distribution, what potential implications might this have for instructional practices, curriculum design, or student support services?
- Discuss the challenges and considerations involved in dealing with multi-modal distributions in statistical analysis or modeling, and how these challenges might be addressed.
- How might the presence of multi-modal distributions influence decision-making processes or policy formulation in areas such as education, healthcare, or business?
- Explore the potential impact of data quality, outliers, or measurement errors on the identification and interpretation of multi-modal distributions.
- Discuss the ethical considerations that may arise when investigating and reporting on multi-modal distributions, particularly when dealing with sensitive or personal data.
- How might the combination of multiple data sources or data fusion techniques contribute to the emergence of multi-modal distributions, and what strategies can be employed to handle such scenarios?
- In the context of longitudinal or time-series data, discuss how multi-modal distributions might evolve over time and what factors could contribute to shifts or changes in the distribution patterns.
- Explore the potential applications of multi-modal distribution analysis in fields such as market segmentation, customer profiling, or risk assessment, and discuss the implications and considerations involved.
Table of Contents: (Click any link below to navigate to that section.)
- What are the possible reasons for the bimodal distribution in this chart?
- Provide 3 hypothetical cases in which a trimodal distribution might be found.
- After detecting a multi-modal distribution, what process can we use to explain the deviation from a normal bell curve?
- Create a 10-item quiz on the entire thread above.
- Provide 15 discussion questions relevant to the content above.


Leave a comment